TeX
Data Structures 2
Academic project for Data Structures II. Benchmarks five sorting algorithms in C across multiple input sizes, then generates performance charts via Python/matplotlib.
Academic project for Data Structures II. Benchmarks five sorting algorithms in C across multiple input sizes, then generates performance charts via Python/matplotlib.
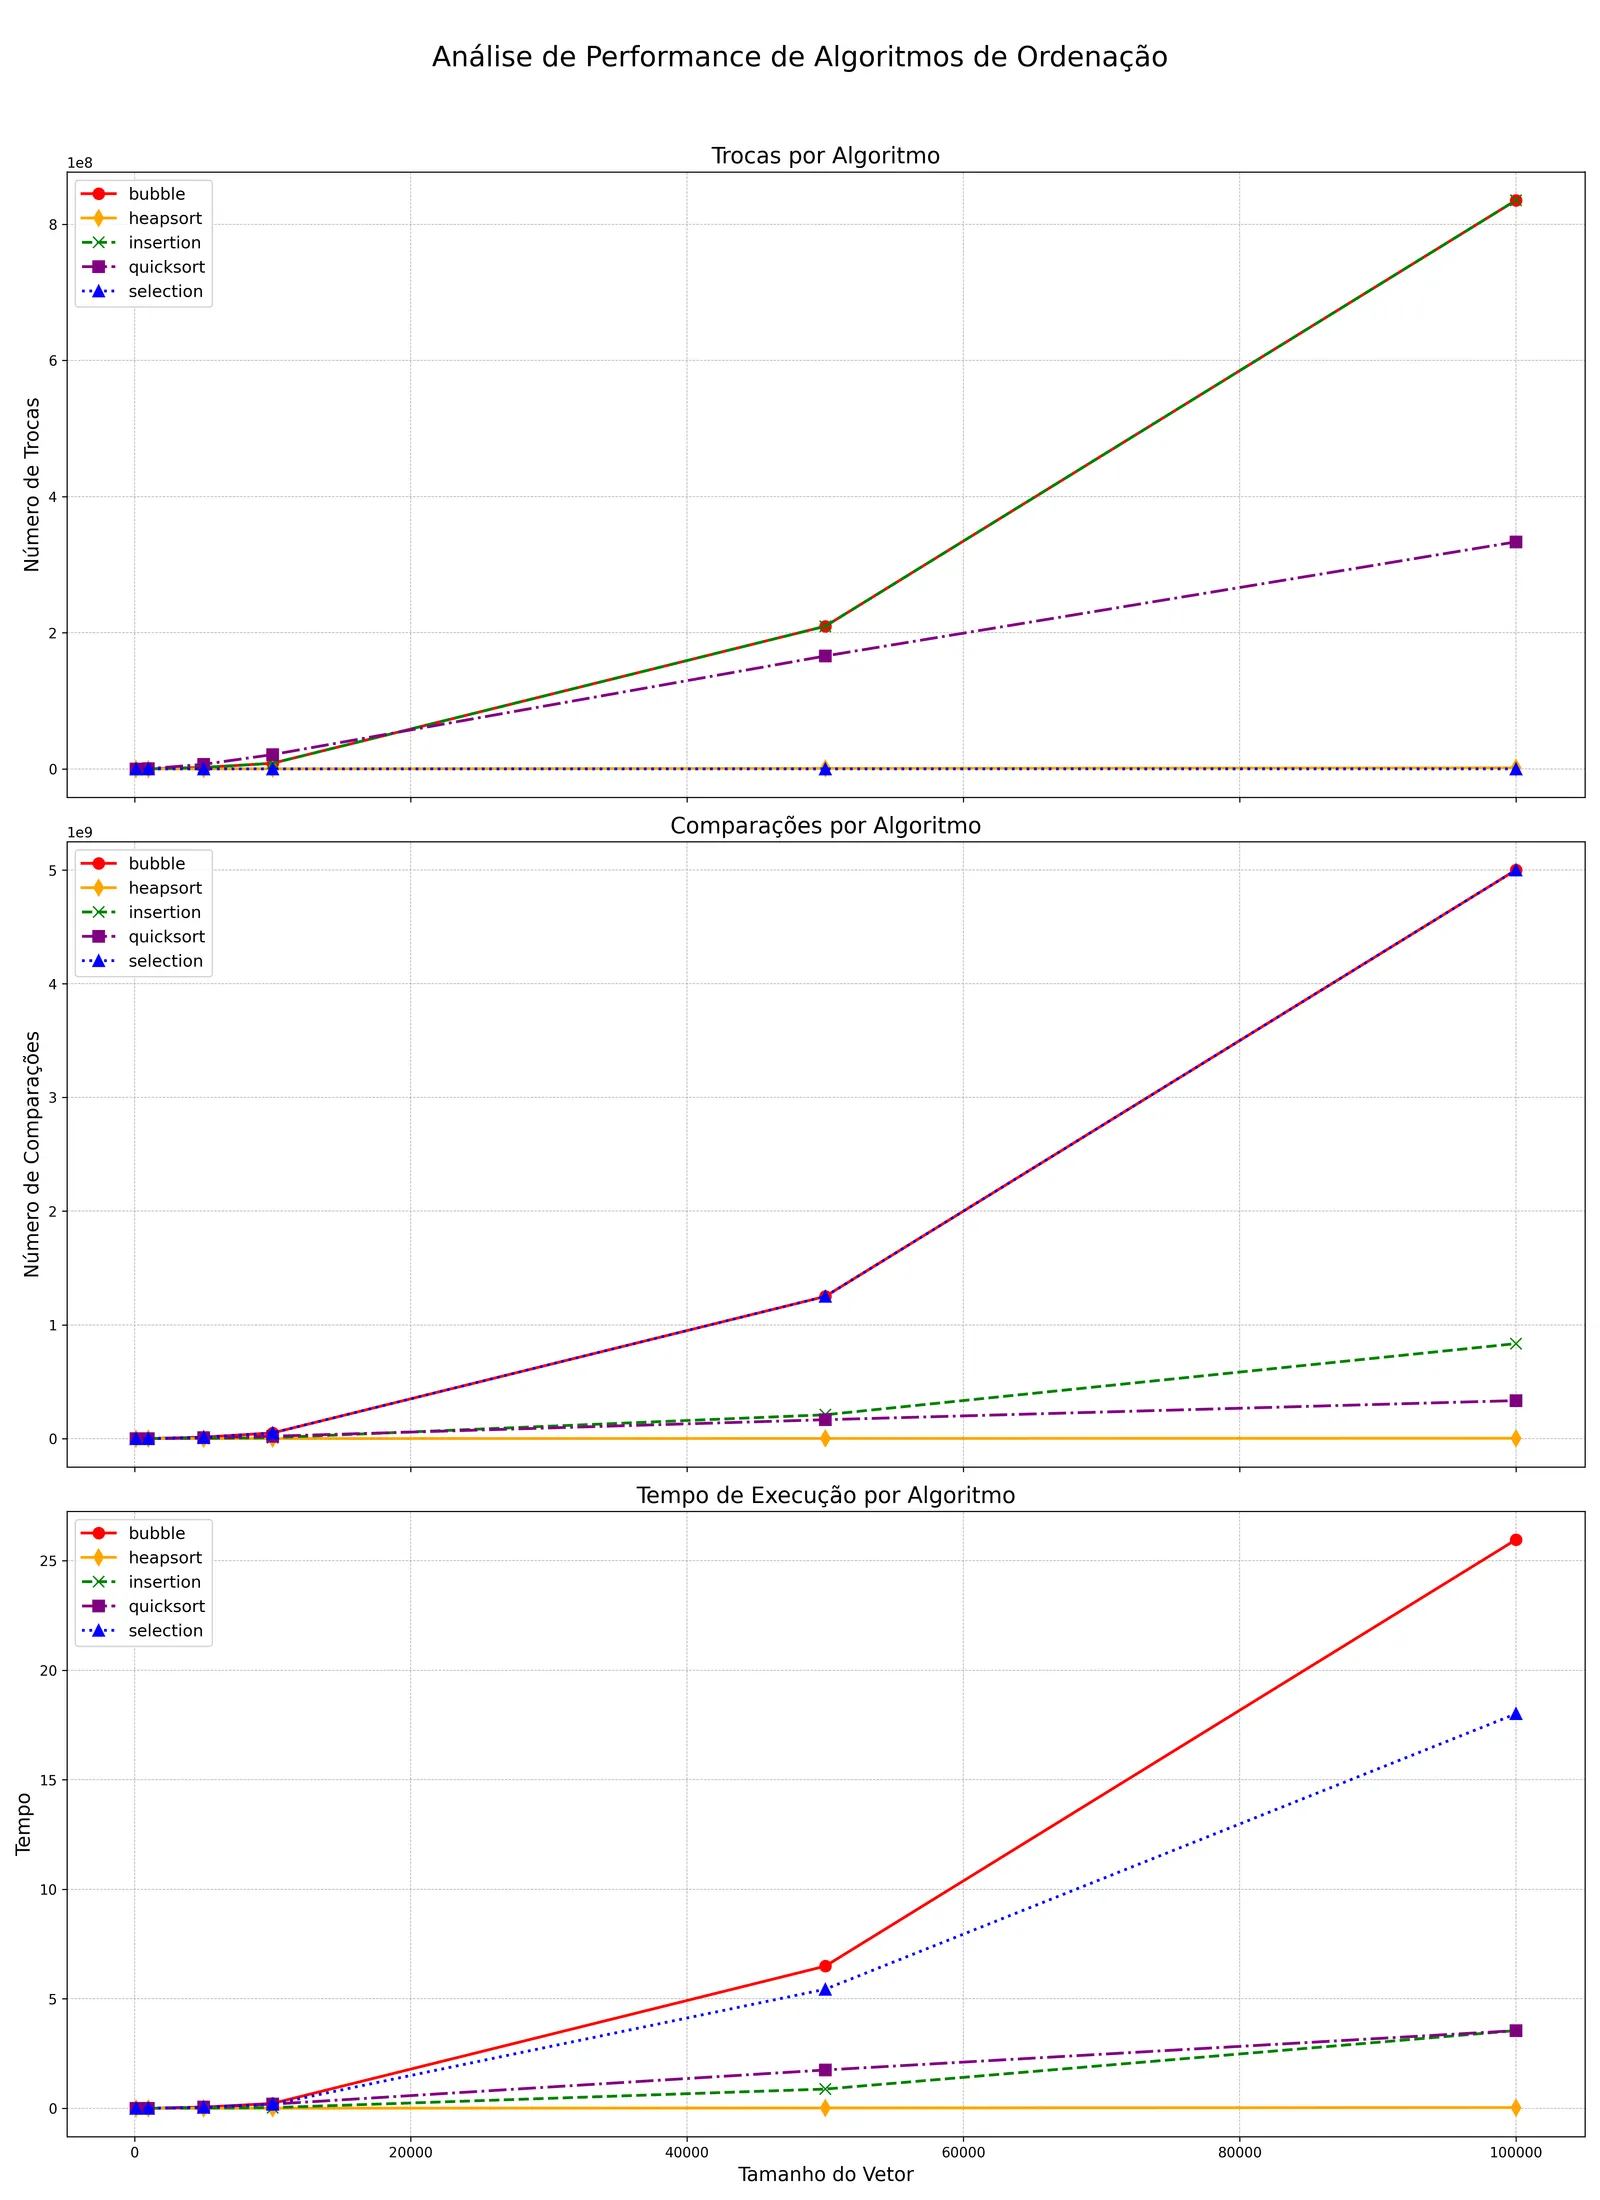
Algorithms
| Algorithm | Average Case | Worst Case |
|---|---|---|
| Bubble Sort | O(n²) | O(n²) |
| Selection Sort | O(n²) | O(n²) |
| Insertion Sort | O(n²) | O(n²) |
| Quick Sort | O(n log n) | O(n²) |
| Heap Sort | O(n log n) | O(n log n) |
How It Works
- C program (
main.c+sorting.c) generates random integer arrays at sizes[100, 1000, 5000, 10000, 50000, 100000], runs each algorithm on a copy, and writes per-run metrics (swaps, comparisons, elapsed time) to binary files under./executions/. - Python script (
main.py) compiles and runs the C program, reads the binary data, and saves performance charts to./graficos/.
Requirements
- GCC
- Python 3
- matplotlib (
pip install matplotlib)
Usage
# Run benchmark + generate charts
python main.py
Or run only the C benchmark:
make
./Trabalho_Pratico_II
Output
Charts saved to ./graficos/:
relatorio_completo.png— swaps, comparisons, and time in one figuretrocas_comparacao.png— swaps per algorithmcomparacoes_comparacao.png— comparisons per algorithmtempo_comparacao.png— execution time per algorithm
Project Structure
.
├── main.c          # Benchmark driver
├── sorting.c       # Algorithm implementations
├── sorting.h       # Function declarations
├── main.py         # Data reader + chart generator
├── makefile
├── requirements.txt
└── executions/     # Binary result files (generated at runtime)